Interactions Between Scavenging Seabirds and Commercial Fisheries Around the British Isles
Robert W. Furness, Anne V. Hudson, and Kenneth Ensor Department of Zoology University of Glasgow, Scotland
Human exploitation of living marine resources has provided an increasing opportunity for some seabirds to take advantage of foods that would otherwise be unavailable to them. Around the British Isles, for example, adult demersal fish such as cod (Gadus morhua), haddock (Melanogrammus aeglefinus), and whiting (Merlangius merlangus) do not normally occur in the diet of the seabirds that are capable of diving to the seabed in shallower areas of the sea. Nevertheless, at some localities and at certain times of year, these fish may represent the bulk of the diet, by mass or energy content, of certain seabirds. These are species incapable of diving to the seabed, but able to exploit the activities of commercial fishing boats; species such as great black-backed gulls (Larus marinus), herring gulls (L. argentatus), lesser black-backed gulls (L. fuscus) great skuas (Catharacta skua), and northern gannets (Sula bassana). Kittiwakes (Rissa tridactyla) may also make extensive use of this feeding opportunity, and smaller numbers of several other species also join flocks at fishing boats. The only source of demersal fish for these species must be from man's activities, the fish being scavenged from behind commercial fishing vessels or, in the case of some gulls, being stolen after the catches have been landed. In addition, offal (fish livers and intestines) from gutting operations carried out on board may be made available to seabirds around vessels and is particularly sought after by northern fulmars (Fulmarus glacialis).
In many respects the interactions between seabirds foraging at fishing vessels are similar to those between seabirds foraging in flocks over shoals of small fish prey available at the surface. However, studying seabirds at fishing boats has a number of advantages. It is possible to conduct experiments where the availability of food is controlled, and so to examine foraging behavior in relation to identified prey species, quantified prey sizes, and controlled rates of presentation of food. This gives great scope for the investigation of foraging efficiency and the effects of intra- and interspecific competition. It also provides a useful model for the natural relationships between foraging seabirds and fish schools at sea such as discussed elsewhere in this volume.
There has been much dispute over the role of human exploitation of fish and marine mammal populations in causing the observed population changes in seabirds, James Fisher (1952, 1966) was convinced that food provided by man during whaling and trawling operations caused the southward spread and population increase of the northern fulmar in the northern Atlantic. However, his view has been challenged. Wynne-Edwards (1962) suggested that the spread was a natural result of genetic or behavioral evolution, and nothing to do with man. Salomonsen (1965) suggested that it was due to a gradual warming of the northeastem Atlantic which favored the large-billed boreal population of the species. Brown (1970) also felt that oceanographic factors were of prime importance since he found little association between northern fulmar distribution in the northwest Atlantic and the distribution of the fishing fleet. Dietary studies at Scottish colonies of northern fulmars showed an enormous difference in food types taken by breeding birds at a colony to the west of Scotland compared with food types taken by breeding birds at a colony to the north of Scotland. Many of the food items important in the diets at these locations were not obtained from fishing boat activities (Furness and Todd 1984). Studies of the densities of northern fulmars through the North Sea (Blake et al. 1984) provided only weak evidence for an influence of fishing boat distribution on northern fulmar distribution at sea. Rather little attention has been paid to the ways in which seabirds exploit fishery waste, and competitive interactions between different scavenging seabird species and age classes, the amounts of offal and discarded whole fish made available to seabirds, or the proportion of this that is exploited. Recent work in Queensland, Australia from prawn trawlers in Moreton Bay indicates that scavenging seabirds (gulls, terns, and cormorants by day and gulls and terns at night) obtain about 30-35 percent of discarded fish during the day and about 16 percent at night, while dolphins account for about 40-50 percent of the discards, and the remainder sink (T.J. Wassenberg, personal communication). Rees (1963) observed scavenging behavior of seabirds in the Gulf of St. Lawrence and the Strait of Belle Isle, and Rodriguez (1972) observed scavenging seabirds at fishing boats off the southwestern coast of Africa. According to the observations of Rodriguez (1972), some 125 freezer trawlers fished in June-July 1967, predominantly for hake (Merluccius), in the 444-by-222 kilometer rectangle bounded by 23o-27oS, 13o-15oE, and discarded a total of 576 metric tons of waste fish and offal daily. Much of this was consumed by huge numbers of associated scavenging seabirds, of which an estimated total of 46,000 albatross and large petrels predominated, particularly black-browed albatross (Diomedea melanophris) and white-chinned petrels (Procellaria aequinoctialis), which fed almost exclusively on the waste. Rodriguez describes the clearly defined differences in the positions behind trawlers taken by each species apparently as a result of differences in competitive abilities and flight characteristics. Abrams (1983) also concluded that the availability of trawler waste had influenced the distributions of scavenging seabirds, particularly black-browed albatross, in the Benguela Current off South Africa and concluded that scavenging behind trawlers had been a factor causing an increase in numbers of black-browed albatross as well.
In this paper we will consider two topics. First, how much food is made available to scavenging seabirds by the fishing industry around the British Isles and to what extent is this utilized by seabirds? Second, how do the scavenging seabirds interact when feeding at boats and do the interactions suggest that the population dynamics of scavenging seabirds may be affected by competition for food at fishing boats?
Methods
Study Area and Fish Catch DataThe study area is defined by the division of the North Atlantic and North Sea as indicated in figure 7.1. Based on the Food and Agriculture Organization (United Nations) map, and used to delineate the Intemational Council for the Exploration of the Seas (ICES) fishing areas. Quantities of each species of fish and shellfish harvested in each of these areas are listed in the statistical bulletins of the ICES, which are published annually. The most recent bulletin, published in 1985 and dealing with fish catches in 1982, has been used as the primary source of information from which we have derived estimates of the amount of food (discards and offal) made available to seabirds in each of the areas in figure 7.1. Comparison with volumes for the years 1977 to 1981 shows that quantities have been fairly consistent between years so that the 1982 data are taken to be indicative of the general pattern for the years immediately before, and probably after, 1982.
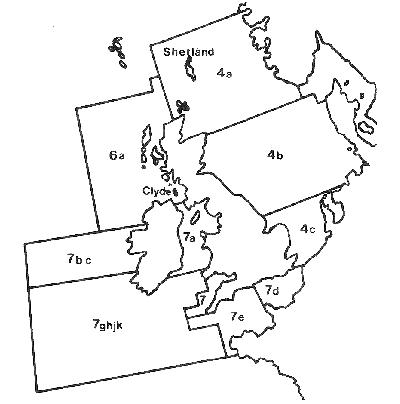
Figure 7.1. ICES fishing areas around the British Isles: 4a-northern North Sea; 4b-central North Sea, 4c-southern North Sea; 6a-northwest Scotland; 7a-lrish Sea; 7bc-western Ireland; 7de-English Channel; 7f-Bristol Channel; 7ghjk-Southwest Approaches.
Discard and Offal Quantities
In order to estimate consumption of fishery waste by seabirds we need to know how we can use data on fish landings in order to assess the quantities of offal and discards (fish of no commercial value plus fish of commercial value that are of a size not worth landing or below the legal size limit) that are thrown back over-board by fishermen and so made available to scavenging seabirds. Quantities of offal and discards produced depend firstly on the fishing method employed and the ways in which the fish are processed, so that observations were made on a number of different types of fishing vessels. Clearly it is not possible to make observations, as ideally required, from all types of fishing vessels of each size and of each nationality in all areas around the British Isles in each session of the year over several years. We have been limited to sampling from British vessels, principally of short trip duration (generally one-day fishing trips from Shetland, the Clyde Sea area, and northwest Scotland), and we have assumed that discarding practices are comparable among vessels of other countries and in other areas around Britain and Ireland. This assumption may not be correct, and so our estimates of quantities of offal and discards may need to be revised if foreign vessels treat their catches appreciably differently from the way that they are processed by British boats.
We also need to determine how much of the available offal and discards is consumed by seabirds. These questions were addressed by making observations from trawlers around the Shetland Islands and in the Clyde Sea area and around the Small Isles Rhum, Eigg, Muck, and Canna) in northwest Scotland (figure 7.1) during their normal fishing activities. We gutted a number of fish of various species in order to estimate the weight of offal as a proportion of fish weight, allowing the total quantity of offal to be calculated from total landing figures. The sizes of catches made at each haul, and quantities of fish discarded, were estimated in terms of boxes of fish, each boxful weighing on average 45 kilograms (Hudson 1986). The quantity landed at market was recorded and this, once corrected to allow for the weight of offal removed, provided an independent check of our estimate of the number of boxes of marketable fish, since this gave the quantity of fish discarded at sea by subtraction from the estimated total catch.
Seabirds Using Fishery Waste
During each fishing trip we counted numbers of seabirds associating with the vessel and behind other vessels; we also observed boats from the mainland and, in the vicinity of Shetland, from a light aircraft. Although results differ between boats of different sizes and fishing methods, between areas and at different times of year, constraints on fieldwork meant that we had to concentrate effort at sea largely on small whitefish trawlers around Shetland in summer and on Norway lobster (Nephrops norvegicus) boats in the Clyde Sea area and around the Small Isles of northwest Scotland throughout the year (figure 7.2). Other studies have dealt with other types of boat and other areas (Irish Sea: Hillis 1971, 1973 and Watson 1981; North Sea: Anstey 1984 and Blake et al. 1984; northwest Scotland: Boswall 1960, 1977 and Lockley and Marchant 1951; southwest England: Lake 1984).
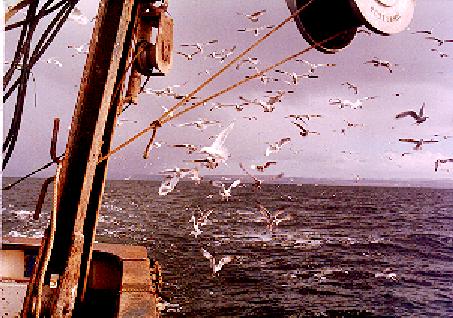
Figure 7.2. Gulls dropping onto discarded fish behind a trawler in the Clyde Sea
In order to convert quantities of discards and offal available to seabirds into a measure of the numbers of birds that may be sustained by scavenging at boats we measured the energy value of offal and discards by bomb calorimetry and estimated the energy requirements of seabirds from bioenergetics equations following the results presented by Ellis (1984).
Feeding Behavior and Interactions
The ability of different age classes and species of seabirds to exploit offal and discards was assessed by experimental discarding performed by ourselves while fishermen were engaged in normal fishing activities (i.e., sorting, gutting, and/or discarding, and/or trawling for the next catch). Individual fish that were about to be discarded by the fishermen were taken, identified as to species, measured, and then discarded. Thus our observations of seabirds taking measured fish were made while birds were also feeding on fish being discarded in the normal way by fishermen. Attempts by seabirds to obtain each individual fish were filmed using a JVC KY19OOEL10 video camera with a synchronized sound track and a JVC CR4400E portable recorder. Subsequently, when the methodology had become routine, the video equipment was replaced by a portable tape recorder and stopwatch system which allowed data to be transcribed much more quickly with little loss of accuracy or information. The following data were recorded: fish species; fish length (mm); species and age (where this could be determined from plumage) of the seabird attempting to take the fish; the outcome of the attempt (fish missed, swallowed, dropped, or stolen); the time taken between fish being grabbed by the bird and either swallowed, dropped, or stolen; whether the bird swallowed the fish on the water or in the air; if birds fought for the fish; the species and age of kleptoparasite; and whether the fish was eventually swallowed or sank. Because some fish were tackled by a series of birds the sequence could occasionally be complex and could only be recorded by video film or by describing events and recorded stopwatch timings into a tape recorder.
Swennen and Duiven (1977) found that the maximum body width and depth (or cross-sectional area) of fish was the key measurement used by alcids in choosing optimal prey sizes. This may be a more important feature of a fish than its length for prey selection by scavenging seabirds as well, but it is difficult to measure maximum fish depth or breadth as accurately or as easily as one can measure fish length, and both depth and breadth measures tend to be influenced by the handling of the fish during capture, since these measurements are more sensitive to effects of pressure change and compaction which result, for example, in the stomachs of many of the fish being forced out through the mouth or the swim bladder ruptured. Also, relationships between fish length and weight or otolith length have been published for many marine fish, but few exist allowing fish breadth or depth to be estimated from otolith dimensions. In this paper we have considered only fish length, as measured, since within a given fish species, fish breadth or depth is closely related with the length of the fish. Behavioral records were analyzed by use of the SPSS and SPSS-X packages on the Glasgow University ICL 2988 computer. Where statistical tests have been performed, significant means p < 0.05.
Results
Fish Discards and Offal Made AvailableObservations from fishing boats catching sand eels (Ammodytes marinus) or other fish for industrial purposes (reduction to oil and fish meal) showed that these fisheries provide very little food for seabirds. Gulls do attend sand eel boats and pick fish from the net when it is hauled, but the total quantity of food obtained is very small by comparison with amounts available from whitefish boats Similarly, boats fishing for herring (Clupea harengus) or mackerel (Scomber scombrus) do not normally provide seabirds with feeding opportunities, although on occasion quotas can result in discarding of these species. Scavenging seabirds obtain most fishery waste from whitefish and Norway lobster boats. All areas around the British Isles except for the Irish Sea are dominated by catches of industrial species, or of herring or mackerel, so that total fish catch data provide little indication of the availability of fishery waste to seabirds. Observations from whitefish and Norway lobster boats indicate that the amounts of fish discarded vary greatly between catches, between boats, between areas, and seasonally. Our data and data of the Department of Agriculture and Fisheries for Scotland (DAFS) suggest that variation between catches is almost as great as variation between areas and seasons (table 7.1), so we have used the same factors to estimate discard quantities from landings data for each fishery region. We have assumed that, for whitefish boats, the discard mass averages 20 percent of the mass of landed haddock and whiting, 10 percent of the mass of landed hake (Merluccius merluccius), ling (Molva molva), pollack (Pollachius pollachius), torsk (Brosme brosme), monkfish (Lophius piscatorius), gumards (Triglidae), and 5 percent of the mass of landed cod and saithe (P. virens). Norway lobster boats, on average, discard about twice as much fish as the quantity of Nephrops caught (table 7.1). These values may be exceeded in certain years when good cohorts recruit into the fishery (for example, DAFS data indicate that as much as 42 and 48 percent of haddock weight caught by seine net vessels in 1975 and 1980 was discarded because of the strong 1974 and 1979 cohorts). Thus, in some years the total amount of discards may be elevated by such occurrences. However, good years for one fish species may not be good for others, so that total discard amounts will fluctuate much less than the discard amounts of particular species.
Table 7.1. Quantities (weights) of fish discarded from fishing boats.
_______________________________________________________________________________
                                 Number of
                                 catches   Average Rate of
Fishing Method     Locality      Sampled   Discarding Fish        Source
_______________________________________________________________________________

Nephrops trawl     Clyde            18   1.8 x mass of Nephrops   This study
                                         catch (range 0.5 x
                                         to 3.0 x)

                   Hebrides          9   2.2 x mass of Nephrops   This study
                                         catch (range 1.0 x
                                         to 3.0 x)

Seine net          North Sea      > 50   33% of haddock caught    Jermyn and
                                         25% of whiting caught   Robb (1981)
                                         10% of cod caught

Motor trawl        North Sea      > 20   20% of haddock caught
                                         20% of whiting caught
                                          1% of cod caught

Light trawl        Shetland        151   27% of whitefish         Hudson


                                         caught (range 1% to      (1986)
                                         85% of catch)
_______________________________________________________________________________
   NOTE: Discard rates are given either as mass of fish as a multiple of the
measured quantity of Nephrops landed by Nephrops trawlers or as a percentage
of  the  total mass of whitefish or whitefish species  caught  by  whitefish
boats. Sample size is the number of separate catches that were examined.
By applying these values to ICES landings data for 1982 we can obtain a crude estimate of the annual total mass of discards in each fishery area (table 7.2). From analyses of the mass of offal in relation to fish mass (table 7.3) we can convert the same fish landings data to quantities of offal discharged, on the assumption that all of these species are gutted at sea and that all offal is discharged (table 7.2). In practice, some fish are landed whole and a few boats may retain offal, but these practices probably have little effect on the overall calculations.
In the Irish Sea, Norway lobster boats are the main source of discard fish, while total discard quantities are much the highest in the north and central North Sea. Offal mass is also much greater in these last two regions than elsewhere (table 7.2).
Norway lobster trawlers use a much smaller mesh net than whitefish trawlers and as a result the fish discarded from Norway lobster trawlers tend to be smaller than those discarded from whitefish trawlers. Around Shetland, most discards were of haddock and whiting with median lengths of 28 and 29 centimeters respectively (Hudson 1986). Discards from Norway lobster boats in the Clyde and around the Inner Hebrides tended to be predominantly 10-20-centimeter flatfish, 10-25-centimeter whiting, Norway pout (Trisopterus esmarkii) or haddock (Ensor and Furness, unpublished data). In the Irish Sea most discards are whiting, dab (Limanda limanda), poor cod (Trisopterus minutus), or Norway pout, and are generally 5-24 centimeters in length (Watson 1981).
Table 7.2. Quantities of offal and fish discards from whitefish and Norway lobster boats around the British Isles.
_______________________________________________________________________________
                                                Whitefish Discarded
                                       ________________________________________
                       Offal Discarded Whitefish Boats    Nephrops Boats
 ICES Fishing Ground    (metric tons)   (metric tons)      (metric tons)
_______________________________________________________________________________
Northern North Sea         40,000          41,000              3,000
Central North Sea          34,000          30,000              8,800
Southern North Sea          9,700           5,300                 10
Northwest Scotland         10,000          13,000             18,000
Irish Sea                   3,700           1,400             20,000
Western Ireland             1,600           1,800              2,500
Eastern English Channel     1,200           1,000                  0
Western English Channel     1,900             900                 20
Bristol Channel             1,000           1,100                 10
Southwest Approaches        4,300           4,500              7,300
_______________________________________________________________________________
NOTES  Data for 1982; for methods of calculation and assumptions made see text.
Calculations of the Numbers of Seabirds Supported by Fishery Waste
The best measurements of the daily energy expenditure of seabirds are recent studies using isotopically labeled water. Ellis (1984) reviewed seven studies of seabirds where such methods indicated daily expenditures of 2.6, 3.0, 3.1, 3.3, 3.4, 4.8, and 5.2 times Basal Metabolic Rate (BMR). Subsequent studies (Gaston 1985; Roby and Ricklefs in press; Birt et al. unpublished data) also indicate that the daily energy expenditure of seabirds is generally between 3 and 4 times BMR. Since most of these studies are of breeding seabirds, and nonbreeders have a lower energy requirement (estimated to be 20 to 30 percent lower in thick-billed murres (Uria lomvia) and black guillemots (Cepphus grylle); Gaston 1985) we have chosen 3 BMR as a suitable estimate of the daily energy requirement of seabirds over the whole year. According to Ellis (1984) seabirds from high latitudes have a greater BMR than tropical seabirds. Herring gulls and great skuas have a measured BMR 1.25 and 1.27 times that predicted by an allometric equation based on data for all seabirds. We assume a BMR in line with these deviations from a common regression, which gives a value of 478 kilojoules per day for a l,000-gram seabird.
Table 7.3. Offal mass as a proportion of total fish mass.
_____________________________________________________________________________
     Source of Data                       Relationship Given
_____________________________________________________________________________
This study                       Offal = 11.0% of mass of gadoid fish caught

This study                       Offal = 6.5% of mass of flatfish caught

DAFS* (A. S. Jermyn, personal    Offal = 11.1% of mass of fish caught
communication)                   Offal = 12.5% of mass of gutted fish

Boswall (1960)                   Offal = 12.5% of mass of fish caught
                                 Offal = 14.3% of mass of gutted fish

Bailey and Hislop (1978)         Offal = 10-15% of gadoid body mass
_____________________________________________________________________________
*Department for Agriculture and Fisheries (Scotland).
From measurements of the calorific value of fish offal and tissues (table 7.4), we have calculated on the basis of offal containing 11 kilojoules g-1 and discards 5 kj g-1. Assuming a food utilization efficiency of 75 percent (derived from Kendeigh, Dolnik, and Gavrilov 1977) we can estimate that a l,000-gram seabird could survive on 64 kilograms of offal per year or on 120 kilograms of discards per year. Most scavenging seabirds around the British Isles are northern fulmars or herring gulls which weigh close to 1,000 grams, while great skuas and great black-backed gulls weigh from 1,200 to 1,800 grams. Kittiwakes at 360 grams and northern gannets at 3,000 grams are rather far from a l,000-gram standard, but represent relatively smaller numbers of the birds obtaining food at fishing boats.
By combining these data with the quantities of offal and discards available (table 7.2), we can estimate the maximum number of l,000-gram seabirds that could be sustained by offal and discards in each area (table 7.5). In theory, if all of the offal and discards were taken, then some 2.8 million l,000-gram seabirds might be supported by this food supply. However, this total exceeds the number of seabirds that could actually be supported. In practice, most offal is taken, although on the occasions when large quantities of offal are washed out of the scuppers at once, much tends to sink before seabirds can reach it. Some discards are too large to be handled or are of species that are not easily swallowed (see below), so that the available offal and discards could only support somewhat smaller numbers than these calculations suggest.
Table 7.4. Caloric value of fish offal and discards.
______________________________________________________________________________
                                          Caloric
                   Fish Length   Sample   Value
Sample Analyzed        (cm)       Size    (kJ/g)             Source
______________________________________________________________________________
Offal (saithe)         28-29       3       7.3              this study
Offal (whiting)        18-28       6      12.6              this study
Saithe (whole)         28-30       2       5.2              this study
Whiting (whole)        18-28       5       5.8              this study
Saithe (whole)          3-4        8       5.1       Harris and Hislop (1978)
Whiting (whole)         4-6        3       4.1       Harris and Hislop (1978)
Saithe (gutted)         29         1       4.9              this study
Whiting (gutted)       18-28       5       4.4              this study
Cod (fillet)             -         3       3.2       Paul and Southgate (l975)
Haddock (fillet)         -         -       3.1       Paul and Southgate (1975)
Plaice (whole)           -         8       3.8  Paul and Southgate (1975)
_______________________________________________________________________________
Seabirds Using Waste in Different Areas
The numbers of each species of seabird in flocks foraging at fishing boats vary considerably between areas and to some extent between seasons (table 7.6).
Foraging Efficiency of Different Age Classes
In the Clyde Sea area juvenile herring gulls missed (i.e., failed to get hold of) 4.4 percent of the discards they attempted to pick up. Significantly fewer were missed by older birds: one-year-old birds missed 0.8 percent while two-year-olds and older birds missed only 0.4 percent (n= 1,365 fish, x22 = 26.7, p < 0.005). In addition, juvenile herring gulls were more likely than adults to drop the fish they did pick up (9.7 percent dropped by first-year birds versus 6.2 percent by adults, x22 = 3.97, p < 0.05)
Table  7.5. Numbers of 1,000-gram seabirds that
could be supported by  offal and discards around
the British Isles.
___________________________________________________
                             1,000-gram Seabirds
                          Potentially Supported By
                         __________________________
  Fishing Ground           Offal       Discards

Northern North Sea        620,000       310,000
Central North Sea         530,000       277,000
Southern North Sea        150,000        38,000
Northwest Scotland        172,000       220,000
Irish Sea                  58,000       153,000
Western Ireland            25,000        31,000
Eastern English Channel    19,000         7,000
Western English Channel    30,000         6,000
Bristol Channel            15,000         8,000
Southwest Approaches       67,000        84,000

 All areas              1,686,000     1,134,000
___________________________________________________
Table 7.6. Numbers of seabirds associated with fishing boats in different areas.
___________________________________________________________________________________________________________
                            Irish Sea       Clyde Sea      Shetland Summer        Eastern      Northwest
                        _________________  ___________  ______________________    Scotland     Scotland
                         Summer   Winter     Winter      Inshorer    Offshore     Winter       Summer
    Seabird               (18)     (32)      (149)         (72)        (40)         ( )          (1)
___________________________________________________________________________________________________________
Northern fulmar            23        3          0          485         721           1          155
                       (0-100)   (0-30)      (0-3)   (10-2,500)   (0-6,000)       (0-4)

Northern gannet            11        6          6            9           3          15            5
                        (0-50)   (0-50)    (0-167)      (0-200)     (0-100)      (0-51)

Herring gull              213      251        241           30           0          87           15
                       (0-800) (10-900)  (0-1,340)      (0-400)                 (0-380)

Lesser black-backed gull    2        0          3            6           0           2            1
                        (0-10)    (0-1)     (0-88)       (0-20)                  (0-28)

Great black-backed gull     5       16          6          234          19           2           90
                        (0-30)   (0-60)     (0-80)   (10-1,000)     (0-300)      (0-24)

Kittiwake                  75       78         24            3           0           0           35
                       (0-200)  (2-400)    (0-285)       (0-50)

Great skua                  0        0          0           12           1           0            0
                         (0-6)    (0-6)      (0-1)       (0-50)      (0-20)
___________________________________________________________________________________________________________
SOURCES: Irsh Sea: Watson 1981; Clyde Sea and Shetland: this study; eastern Scotland: Anstey 1984;
northwestern Scotland: Boswall 1960.
NOTES: Summer = April-July, winter = October-February; numbers of counts are given in parentheses below
the location heading; minimum and maximum counts are given in parentheses below means except where all
counts were zeros.
Adult herring gulls in the Clyde obtained more fish per bird than did immature herring gulls (table 7.7). Adult herring gulls were also more selective in the sizes of fish they took. While mean fish lengths were almost the same (first year birds, 24.6 cm; two- to four-year-olds, 24.5 cm; adults, 24.9 cm), the variance of fish length was greater for first-year birds (13.76) than for two-to four-year-old birds (11.70) or adults 18.46). Adults were less likely than juveniles or immature birds to take particularly small or particularly large fish = 1.626, p < 0.001, F448,404 = 1.383, p < 0.05).
Around Shetland in summer the largest numbers of discard fish were taken by great black-backed gulls, many of which were immature birds. For both adults and immature birds the handing time of fish (time taken from grabbing the fish to swallowing it) increased at an accelerating rate with fish length. Handling times of immature birds were longer for all fish sizes than those of adults and the relationships between log handling time and log fish length were linear (fig. 7.3).
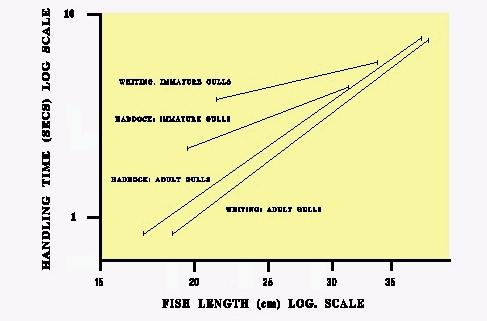
Figure 7.3. Log. handling times (secs.) of haddock and whiting by adult and immature great black-backed gulls at trawlers around Shetland in relation to log. fish length (cm).
Table 7.7. Numbers of discard fish swallowed by scavenging seabirds behind Nephrops trawlers in the Clyde in relation to numbers predicted from the relative numerical abundance of each species and age class.
_________________________________________________________________________________________________
                                         Mean Number                                    Relative
                                         Present        Fish         Expected Number    Foraging
    Species            Age               per Boat       Swallowed    Swallowed*         Success
_________________________________________________________________________________________________

Northern gannet            Adult           5.7            53             25.9             2.05
Great black-backed gull    All             6.0            35             27.3             1.28
Herring gull               Adult          78.5           405            357.9             1.13
Herring gull               Immature      162.7           742            742.1             1.00
Lesser black-backed gull   All             2.6            11             11.9             0.92
Kittiwake                  Adult          21.8            27             99.4             0.27
Kittiwake                  Immature        2.3             1             10.6             0.09
_________________________________________________________________________________________________
NOTES: Null hypothesis that birds of all species and age have equal
likelihood of obtaining each fish; relative foraging success is calculated
as number of fish swallowed divided by expected number.
*Derived from the relative abundance of the birds.
Foraging Efficiency of Different Species
When offal was discarded from Shetland trawlers virtually all of it was consumed by northern fulmars. The large numbers and aggressive behavior of northern fulmars generally precluded other species from entering the area close beside the boat where offal was discharged (figure 7.4). In areas where northern fulmars were rarely found (e.g., the Clyde Sea) offal was taken by gulls in preference to discard fish, as might be expected since it has a considerably higher calorific value. Northern fulmars have great difficulty swallowing whole fish and around Shetland they tended to consume offal but ignore fish. Although northern fulmars outnumbered gulls, skuas, and northern gannets around inshore Shetland trawlers by a factor of 1.65 to 1 (table 7.6), they swallowed only 88 of the fish experimentally discarded, compared to the 3,705 swallowed by gulls, skuas, and northern gannets. Thus northern fulmars represented 62.3 percent of all the birds present but obtained only 2.3 percent of the discards swallowed.
Comparing the foraging success of adult seabirds taking discards behind Nephrops trawlers in the Clyde Sea area, northern gannets swallowed all 53 fish they attempted to take (100 percent); lesser black-backed gulls obtained 9 in 9 attempts (100 percent); great black-backed gulls obtained 21 in 22 attempts (95 percent); herring gulls obtained 405 in 477 attempts (85 percent); and kittiwakes obtained 27 in 32 attempts 184 percent). Apart from 3 fish missed by herring gull adults, the failure to swallow fish was due either to the fish being dropped or to it being stolen by a kleptoparasite.
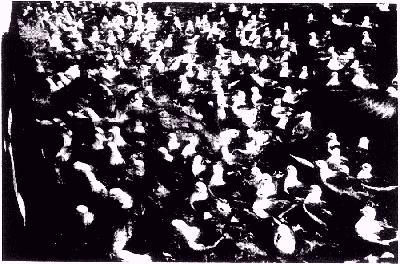
Figure 7.4. Fulmars scavenging offal around a trawler in Shetland.
Although kittiwakes obtained 84 percent of fish that they attempted to take, the species took a much lower proportion of all fish discarded than would have been predicted from the numbers of each seabird species present (table 7.7). Numerically, immature herring gulls predominate around boats in the Clyde and took fish in the proportion predicted by their abundance relative to all seabirds present. Northern gannets took twice as many fish as their numbers would have predicted. Great black-backed gulls and adult herring gulls also obtained more than their numerical abundance would have predicted. The differences between observed and expected numbers taken by each species and age class are highly significant (X26 = 98.1, p < 0.001).
One reason for kittiwakes and lesser black-backed gulls only attempting to take a fraction of the number of fish taken by larger species is that they are unable to handle and swallow large fish. The mean length of fish swallowed by each species is less than the mean length of fish dropped, and increases with seabird size (table 7.8).
The handling times of all seabirds around Shetland increased at an accelerating rate as fish length increased (figure 7.5). Northern gannets and great black-backed gulls were considerably quicker at swallowing fish than herring gulls or great skuas and also managed to swallow larger fish. Northern fulmars were particularly slow to swallow fish. These differences in handling times between species were statistically significant.
Table  7.8. Mean lengths of fish taken by seabirds around Nephrops  trawlers in the Clyde.
___________________________________________________________________________________________
                                         Fish Swallowed                Fish Dropped

    Species                          N    mean (cm)   s.d.         N    mean (cm)     s.d.
___________________________________________________________________________________________

Northern gannet                     53      28.3      3.6          0       -           -
Great black-backed gull             35      29.0      3.4          2     32.5         0.7
Herring gull                     1,147      24.7      3.2        100     27.6         2.7
Lesser black-backed gull            11      21.9      4.9          1     26            -
Kittiwake                           27      15.8      2.9          5     16.4         4.6
___________________________________________________________________________________________
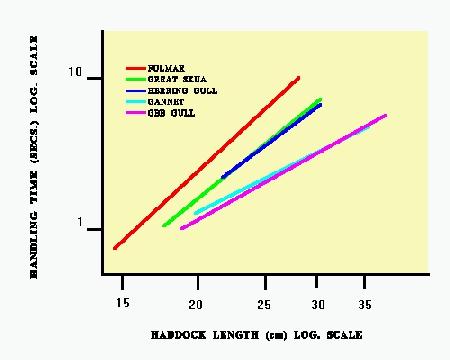
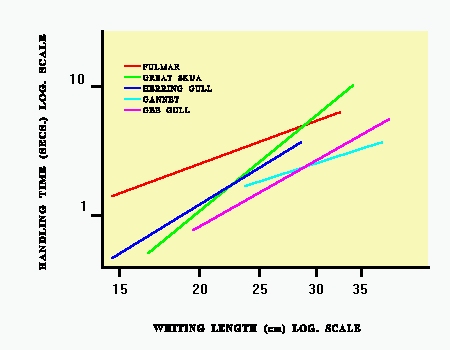
Figure 7.5. Log. handling times (secs.) of haddock and whiting by adult northern gannets, great black-backed gulls, great skuas, herring gulls and northern fulmars at trawlers around Shetland in relation to log. fish length (cm).
Feeding Interactions
Although great skuas have the reputation of being specialist kleptoparasites, most stealing of discards in foraging flocks at trawlers around Shetland was done by great black-backed gulls, and great skuas lost more fish to kleptoparasitism than they obtained in this way (table 7.9). In general, larger species of seabirds tended to steal more than smaller seabirds and this appears to be related to the difficulty that the smaller species had in swallowing the larger discarded fish. The mean length of fish stolen from great skuas 128.3-cm haddock and 29.9-cm whiting) were significantly larger than the mean lengths of these fish swallowed by great skuas (25.5-cm haddock and 27.4-cm whiting;. t= 7.7 and 7.2 respectively, p < 0.01). Kleptoparasitism appears to provide an important part of the total discard consumption of great black-backed gulls (table 7.9) and is also an important cause of loss of fish for herring gulls and lesser black-backed gulls.
In the Clyde, kittiwakes were never, and northern gannets rarely, seen stealing fish. Herring gulls were less often kleptoparasitic than were lesser black-backed gulls or great black-backed gulls, although because of their numerical predominance in the area most fish were stolen by herring gulls (the proportions of discarded fish swallowed that were obtained by kleptoparasitism increased as follows: kittiwakes 0.0 percent, northern gannets 1.9 percent, herring gulls 7.9 percent, lesser black-backed gulls 9.1 percent, great black-backed gulls 12.9 percent: the total was 1,277 fish swallowed).
As a consequence of size preferences and kleptoparasitic interactions most discarded fish were consumed by seabirds, although flatfish, gurnards, and roundfish more than 35 centimeters in length tended to be ignored unless nothing else was available. Overall about 75 percent of all experimental discards were taken by seabirds both around Shetland and in the Clyde and around the Small Isles. This proportion probably applies to the fish discarded by fishermen too, except where catches include high proportions of flatfish, which are often ignored by seabirds and also tend to sink faster than roundfish.
Discussion
The quantities of offal and discarded fish made available to scavenging seabirds in the sea areas round the British Isles (figure 7.1) are enormous and could possibly support as many as 2.5 million 1,000-gram seabirds ltable 7.5; allowing for 25 percent of discards being lost to seabirds). Data in the ICES statistical bulletins indicate that there is little seasonal variation in total catches of fish. This is probably the case also for provision of offal and discards, although there is a brief hiatus over the Christmas and New Year period when most fishermen are at home. We cannot say at present whether seabird requirements for offal and discards is greater in summer or winter. Some species are migratory, while the availability of alternative foods (e.g., surface shoals of sand eels) also varies between seasons.Tab1e 7.9. Kleptoparasitic interactions involving scavenging seabirds at trawlers around Shetland
                                                               Fish Obtained or
                                                               Lost as a
                                                               Consequence of
                         Number of Fish     Number of Fish     Kleptoparasitism *
                         Obtained by        Lost to            __________________
     Species             Kleptoparasitism   Kleptoparasitism   Obtained    Lost
_________________________________________________________________________________
Great black-backed gull
adult)                         335                173             12.7      6.5

Great black-backed gull
(immature)                      44                 36              9.6      7.9

Northern gannet                 58                 40             10.8      7.5

Great skua                      94                135             17.2     24.6

Herring gull                     5                 58              2.2     25.9

Lesser black-backed gull         0                 27              0.0     32.1

Northern fulmar                  2                 69              1.3     43.4
_________________________________________________________________________________
*(As a percentage of all discarded fish handled by the species.)
Clearly seabirds cannot consume all of the offal and discards made available by fishing boats. Some must sink or be taken by fish or marine mammals. However, our observations in the Clyde, Inner Hebrides, and around Shetland indicate that very little offal is not obtained by seabirds, and few discards other than flatfish or roundfish of more than 35 centimeters in length are not consumed by birds. Probably about 90 percent of offal and 75 percent of discards are taken. Off eastern Canada, fishermen clean whitefish by cutting off the head and throwing it into the sea with the guts attached. This rapidly sinks and so seabirds are able to obtain only a small part of the offal before it has sunk too deep for them to reach it (R. G. B. Brown, personal communication). This simple difference in gutting method (British fishermen remove the guts from the slit-open abdominal cavity without taking the head off the fish) is a major determinant of the ability of scavenging seabirds to exploit offal. Around the British Isles, offal thrown overboard by fishermen tends to float, since the liver in particular is buoyed up by its high lipid content.
Recent estimates of seabird population sizes in northwest Europe (Evans 1984) indicate that there are well over 3 million scavenging seabirds in the fishery areas around the British Isles. Estimates of the breeding populations in the British Isles alone are of 600,000 northern fulmars (breeding individuals), 700,000 herring gulls, 300,000 northern gannets, 50,000 great black-backed gulls, 100,000 lesser black-backed gulls, 1.1 million kittiwakes, and 20,000 great skuas. There is probably an equal number of immature birds of each of these species. Further, large numbers of herring gulls breed on the continental coast of Europe. In addition, large numbers of birds from populations in Norway, Iceland, and the Faeroe Islands spend the winter around the British Isles and some nonbreeders may remain in British waters all year. A large proportion of the herring gulls around Shetland and on the east coast of Britain in winter are from an estimated 200,000 pairs breeding in northern Norway (Coulson et al. 1984), while the numbers of great black-backed gulls (particularly immature gulls) that we recorded around Shetland in summer greatly exceeded the number that could be attributed to British breeding colonies alone, and presumably originate from the much larger populations of that species found in Norway (an estimated 60,000 pairs; Evans 1984). Since the Norwegian local fishery for demersal fish is principally one of longline fishing for cod, which results in little or no discarding, it is perhaps not surprising that immature Norwegian gulls may prefer to feed around Shetland where discard volumes are very large (table 7.2).
Because the estimates of total seabird population sizes (including nonbreeders) are not verv precise, and knowledae of their movements is limited, and because the estimates of the total mass of offal and discards are very crude, we cannot infer that there is not enough offal and discard fish to satisfy the requirements of scavenging seabird populations, but the data suggest that seabird numbers considerably exceed the estimated 2.5 million or so that could be supported on fishery waste alone.
Clearly there are differences in both the geographical distributions and habitats used by each scavenging seabird species. Northern fulmars predominate around Shetland and northwest Scotland, while herring gulls predominate in the Irish Sea, the Clyde Sea, and off eastern Scotland. While northern fulmars represent two-thirds of the seabirds behind trawlers inshore around Shetland in summer, they represent over 95 percent of the seabirds behind offshore trawlers. Interestingly, great black-backed gulls show a greater tendency to utilize the offshore habitat than do herring gulls (table 7.6), a pattern also found on the Grand Banks and Scotian Shelf (R. G. B. Brown, personal communication).
Our observations of the feeding behavior of scavenging seabirds at boats indicate that there is indeed considerable competition for food. There is a clear dominance hierarchy, with northern fulmars at the apex, able to obtain the choicest pickings which are clearly fish livers or the entire offal. For anatomical reasons northern fulmars are unable to swallow whole fish efficiently unless these are particularly small, so that northern gannets and adult great black-backed gulls obtain the pick of the discard fish and generally achieve the highest feeding rate on discards (table 7.7). Immature great black-backed gulls are less efficient than adults (figure 7.2), a situation found for herring gulls foraging at garbage dumps (Burger and Gochfeld 1981; Greig, Coulson, and Monaghan 1983).
Great skuas, although often attempting to steal fish by kleptoparasitism, are unable to swallow many of the large fish taken by great black-backed gulls and as a result they are robbed of large fish more often than they obtain fish by robbery (table 7.9). Herring gulls are outcompeted by great skuas, great black-backed gulls, and northern gannets around Shetland. In the Clyde and Irish seas herring gulls predominate numerically and do not have to compete with large numbers of the larger seabirds. Fish discarded from Norway lobster trawlers are smaller and so can be utilized by herring gulls and to some extent by kittiwakes, which are generally unable to obtain food at boats around Shetland. However, kittiwakes have difficulty competing with herring gulls and their foraging success at boats is low (table 7 7), partly because they drop more fish than do larger birds (table 7.8).
Kleptoparasitism tends to result in unusually large fish being stolen, but it is not clear whether kleptoparasites select victims on the basis of the size of fish they carry (as suggested by Brockman and Bamard 1979), or whether the longer handling times of birds with large fish make them more vulnerable to kleptoparasitism. Although great skuas lost more fish to kleptoparasites than they stole (table 7.9) they were the most kleptoparasitic of the species around boats in Shetland, obtaining 17.2 percent of their fish by kleptoparasitism compared to 12.7 percent stolen by adult great black-backed gulls and 9.6 percent stolen by immature great blackbacked gulls. This is consistent with the idea that great skuas are more specialized kleptoparasites than gulls (Furness in press). The lower foraging success of great skuas reflects both the problems they have handling large fish and the fact that they are greatly outnumbered by great black-backed gulls around Shetland boats.
The fact that offal availability is very high in the north and central North Sea and northwest Scotland by comparison with other areas is interesting since it is in these areas that northern fulmar numbers are highest. The low availability of offal further southwest might have been one factor inhibiting northern fulmars from colonizing these regions in large numbers. However, the extent to which discards and offal may influence population dynamics is unclear. Breeding northern fulmars in Shetland fed extensively on sand eels when these were abundant (Furness and Todd 1984). In the last three summers, industrial catches, and apparently recruitment, of sand eels around Shetland have been declining, with the 1985 year class considered to be the poorest since industrial fishing for sand eels began around Shetland in 1974, and so the poorest cohort on record (Gauld, McKay, and Bailey 1986). Sand eels have not been prominent in northern fulmar diets (Hudson 1986), suggesting that the extent to which northern fulmars make use of offal may depend in part on the availability of other foods. Study of great skua diets between 1973 and 1977 indicated that discards were taken as the principal food of nonbreeders, but that breeders took a higher proportion of sand eels and fed the chicks predominantly on sand eels (Furness and Hislop 1981). Since 1981 great skua diets have contained a much lower proportion of sand eels, which also reflects the reduction in sand eel recruitment, and probably in stock size. In addition, the tendency for nonbreeders to make more extensive use of fishery waste appears to be a general one. Obtaining fish from boats probably requires more time but less effort than catching shoaling fish such as sand eels. Since gliding along behind a fishing boat is probably not energetically costly for a gull or a skua (perhaps costing about 3 BMR; Furness and Monaghan 1987), while flying rapidly out to a shoal of sand eels and competing for position in a feeding flock above the shoal will cost as much as or more than the cost of sustained flapping flight (about 10 BMR; Furness and Monaghan 1987), then the energetic cost of following fishing boats to await an opportunity to obtain discards and offal may be no more than existence costs and may result in a better reward to nonbreeders than attempting, at high energy cost, to compete with adults at sand eel shoals. Adults may prefer to expend this extra energy in order to minimize the time spent foraging so that they can feed their chicks rapidly and spend more time guarding them. Although numbers of all scavenging seabirds in the British Isles have increased over this century (Cramp, Bourne, and Saunders 1974), numbers of kittiwakes, lesser black-backed gulls, and herring gulls breeding in many Shetland colonies have decreased over the last ten years, while numbers of great skuas have almost stopped increasing. Northern fulmar and northern gannet numbers have continued to increase, while trends in great black-backed gull numbers are uncertain. These trends generally reflect the competitive abilities of these species at fishing boats. It is tempting to suggest that the changes in numbers may be due to the consequences of competitive abilities of these species at fishing boats but it would be unwise to assert this until more is known about the importance of discards and offal in determining the survival rates and breeding success of scavenging seabirds. However, in a parallel situation at garbage dumps in New Jersey, Burger (1981) found that laughing gulls (larus atricilla) were unable to successfully compete with herring gulls, and she speculated that this competitive disadvantage prevented the laughing gull population from increasing where herring gulls were abundant and exploited the dumps to their full potential. It is proposed that the net mesh size used by whitefish trawlers around the British Isles should be increased to 90 millimeters from January 1987, and possibly further increased at successive stages in the future, in order to reduce fishing effort on smaller-size classes of demersal fish. This would have important and interesting implications for scavenging seabirds, since we have shown that the smaller species cannot utilize the largest discard sizes effectively. An increase in net mesh size will presumably have two immediate effects. First, it will reduce the total quantity of fish discarded. Second, it will increase the mean size of discarded fish. Both of these trends seem likely to reduce food availability to scavenging seabirds, but particularly to herring gulls, lesser black-backed gulls, and great skuas, the species that presently make most use of the smallest discards. We might expect a shift in the balance between species, with northern gannets and great black-backed gulls little affected by the changes but the smaller species finding it increasingly difficult to compete with the larger birds for discarded fish.
Summary
Scavenging seabirds can obtain food in the form of fish offal and discarded whole fish from the activities of fishing fleets around the British Isles. The amounts of food made available depend on the fishing method. Whitefish and Norway lobster boats provide most of the food available to scavenging birds at sea. Most discarded whole fish are small (10-25 cm) gadoids from Norway lobster boats or 25-30-centimeter gadoids from whitefish boats. Quantities of offal discarded represent about 11 percent of the mass of gadoids and 6.5 percent of the mass of flatfish processed for market. Crude calculations suggest that offal and discards around the British Isles could support up to 2.5 million l,000-gram seabirds. Northern fulmars predominate at fishing boats in north and northwest Britain and offshore, with herring gulls predominant further south. Great black-backed gulls are also numerous at fishing boats inshore in the north and northwest, and kittiwakes mainly attend boats further south or east. Northern gannets, great skuas, and lesser black-backed gulls also exploit fishery waste. Adult scavenging seabirds are more efficient at feeding than are juveniles or immature birds. Northern fulmars dominated other species and so obtained almost all of the offal in northern Britain. Northern gannets had a higher foraging success on discards than did other species, and foraging success tended to decline with decreasing body size. Handling time increased with fish size, and larger seabirds had shorter handling times for a given length of fish. Larger species tended to steal fish from smaller species, although northern gannets were not kleptoparasitic. Flatfish and fish difficult to swallow due to bony exteriors were generally avoided. We estimated that 90 percent of offal and about 75 percent of discarded whole fish were consumed by seabirds. The implications of competitive interactions for food at fishing boats, of net mesh size, and of discarding practices on seabird population dynamics are briefly discussed.Acknowledgments
This study was supported by a grant from the Natural Environment Research Council. The assistance of the Department of Agriculture and Fisheries for Scotland and the University Marine Research Station at Millport is gratefully acknowledged. Jim Atkinson, Roger Bailey, John R. G. Hislop, Geoff Moore, and Stan Jermyn provided advice, logistical assistance, and comments on an earlier draft. Numerous skippers and crew of fishing boats in Shetland, the Clyde, and Mallaig allowed us to make observations while they were working and gave us generous hospitality on board. Cathy McClaggan kindly assisted with bomb calorimetry. We are also grateful to Joanna Burger and Dick Brown for helpful comments on the submitted manuscript, and thank Dick Brown and Tom Wassenberg for providing useful comparisons with our work from the northwest Atlantic and Australia respectively.References
Abrams,  R.  W. 1983. Pelagic seabirds and trawl-fisheries in  the  southern
    Benguela Current region. Mar. Ecol. Prog. Ser.11:151-156.
Anstey,  S. 1984. The foraging at fishing boats by wintering Herring  Gulls.
    Thesis, University of St. Andrews, St. Andrew, Scotland.
Bailey,  R.  S.  and  J. R. G. Hislop, 1978. The  effects  of  fisheries  on
    seabirds in the northeast Atlantic. Ibis 120:104-105.
Blake,  B. F., M. L. Tasker, P. Hope Jones, T. J. Dixon, R. Mitchell and  D.
    R.  Langslow. 1984. Seabird distribution in the North Sea.  Huntingdon:
    Nature Conservancy Council. Huntingdon, England.
Boswall,  J.  1960.  Observations on the use by seabirds  of  human  fishing
    activities. British Birds 53:212-215.
Boswall,  J. 1977. The use by seabirds of human fishing activities.  British
    Birds 70:79-81.
Brockman,  H. J. and C. J. Barnard. 1979. Kleptoparasitism in  birds.  Anim.
    Behav. 27:487-514.
Brown,  R.  G. B. 1970. Fulmar distribution: a  Canadian  perspective.  Ibis
    112:44-51.
Burger,  J.  1981. Feeding competition between Laughing  Gulls  and  Herring
    Gulls at a sanitary landfill. Condor 83:328-335.
Burger,  J.  and  Gochfeld,  M.  1981.  Age-related  differences  in  piracy
    behaviour of four species of gulls, Larus. Behaviour 77:242-67.
Coulson,  J. C., P. Monaghan, J. E. L. Butterfield, N. Duncan, K. Ensor,  C.
    Shedden,  and C. S. Thomas. 1984.  Scandinavian Herring Gulls  wintering
    in Britain. Ornis Scand. 15:79-88.
Cramp,  S., W. R. P. Bourne, and D. Saunders. 1974. The Seabirds of Britain
    and Ireland. London: Collins.
Ellis, H. 1984. Energetics of free-ranging seabirds. In G. C. Whittow and H.
    Rahn eds., Seabird Energetics, pp. 203-234. New York: Plenum Press.
Evans,  P.  G.  H. 1984. Status and conservation of  seabirds  in  northwest
    Europe  (excluding  Norway and the USSR). In J. P. Croxall,  P.  G.  H.
    Evans and R. W. Scheiber, eds., Status and Conservation of the  World's
    Seabirds,  pp.  293-32R  International Council  for  Bird  Preservation
    Cambridge.
Fisher, J. 1952. The Fulmar. London: Collins.
Fisher,  J. 1966. The Fulmar population of Britain and Ireland,  1959.  Bird
    Study 13:576.
Furness, R. W. 1982. Competition between fisheries and seabird  communities.
    Adv. Mar. Biol. 20:225-307.
Furness,  R.  W.  1984. Seabird-fisheries  relationships  in  the  northeast
    Atlantic  and North Sea. In D. N. Nettleship, G. A. Sauger, and  P.  F.
    Springer,  eds.,  Marine Birds: Their Feeding  Ecology  and  Commercial
    Fisheries Relationships, pp. 162-169. Dartmouth, Nova Scotia:  Canadian
    Wildlife Service Special Publication.
Furness,  R.  W. In press. Kleptoparasitism in seabirds. In J.  P.  Croxall,
    ed.,  Seabirds:  Their Feeding Ecology and Role in  Marine  Ecosystems.
    Cambridge: Cambridge University Press.
Furness, R. W. and J. R. G. Hislop. 1981. Diets and feeding ecology of Great
    Skuas during the breeding season in Shetland. J. Zool., Lond. 195:1-23.
Furness,  R. W. and P. Monaghan. 1987. Seabird Ecology. Glasgow and  London:
    Blackie.
Furness,  R.  W.  and  C.  M. Todd.  1984.  Diets  and  feeding  of  Fulmars
    (Fulmarus glacialis) during the breeding season: a  comparison
    between St. Kilda and Shetland colonies. Ibis 126:379-387.
Gaston,  A. J. 1985. Energy invested in reproduction by Thick-billed  Murres
    (Uria lomvia). Auk 102:447-458.
Gauld,  J.  A., D. W. McKay, and R. S. Bailey, 1986. Current  state  of  the
    industrial fisheries. FishingNews (June 1986), pp. 30-31.
Greig, S., J. C. Coulson, and P. Monaghan. 1983. Age-related differences  in
    foraging success in the Herring Gull (Larus argentatus).  Anim.
    Behav. 31:1237-1243.
Harris,  M.  P.  and  J. R. G. Hislop. 1978.  The  food  of  young  puffins,
    Fratercula arctica. J.Zool.,Lond.185:213-236.
Hillis,  J. P. 1971. Seabirds scavenging at trawlers in Irish waters.  Irish
    Nat. J. 17:129-32.
Hillis,  J.  P. 1973. Seabirds scavenging at the trawler in the  Irish  Sea.
    Irish Nat. J. 17.416-418.
Hudson,  A.  V.  1986. The biology of seabirds utilising  flshery  waste  in
    Shetland.  Ph.D. thesis, University of Glasgow, Scotland.
International Council for the Exploration of the Seas Bulletins  Statistique
    des  Peches  Maritimes. Cons. Int. Explor.  Mer.  (Copenhagen).  Annual
    issues.
Jermyn,  A. S. and A. P. Robb. 198R Review of the Cod, Haddock and  Whiting,
    discarded  in the North Sea by Scottish fishing vessels for the  period
    1975-1980.  International  Council for Exploration of  the  Seas  Mimeo
    Report, Denmark.
Kendeigh,  S. C., V. R. Dolnik, and V. M. Gavrilov. Avian energetics. In  J.
    Pinowski and S. C. Kendeigh, eds., Granivorous Birds in Ecosystems, pp.
    127-204. Cambridge: Cambridge University Press.
Lake, N. C. H. 1984. A study of the discarding of fish at sea by  commercial
    fishing   vessels   its  impact  and  implications.   Thesis,   Plymouth
    Polytechnic, Plymouth,
Lockley, R. M. and S. Marchant, 1951. A midsummer visit to Rockall.  British
    Birds 44:373-383.
Paul,  A.  A.  and D. A. T. Southgate. 1978.  McCance  and  Widdowson's  The
    Composition of Foods. 4th ed. London. HMSO.
Rees, E. I. S. 1963. Marine birds in the Gulf of St. Lawrence and Strait  of
    Belle Isle during November. Can. Field. Nat. 77:98-107.
Rodriguez,  L. 1972. Observaciones sobre aves marinas en las pesquerias  del
    atlantico sudafricano. Ardeola 16:159-192.
Salomonsen, F. 1965. The geographical variation of the Fulmar  (Fulmarus
    glacialis)  and  the  zones  of marine  environment  in  the  North
    Atlantic. Auk 82:327-355.
Swennen,  C. and P. Duiven. 1977. Size of food objects of three  fish-eating
    seabird  species: UA aalge, Alca torda, and Fratercula  arctica  (Aves,
    Alcidae). Neth. J. Sea. Res. 11:92-98.
Watson,  P.  S. 1981. Seabird observations from commercial trawlers  in  the
    Irish Sea. British Birds 74:82-90.
Wynne-Edwards,  V.  C.  1962.  Animal  Dispersion  in  Relation  to   Social
    Behaviour. Edinburgh: Oliver and Boyd.